
Friday 21 March 2025
Scientists have made a significant breakthrough in the field of time series forecasting, developing a new approach that combines visual and textual data to make more accurate predictions about future events.
Time series forecasting is used in many different fields, including finance, weather prediction, and energy production. It involves analyzing patterns in historical data to predict what will happen in the future. However, this type of analysis can be complex and challenging, especially when dealing with large amounts of data or irregular patterns.
The new approach uses a combination of visual and textual data to make predictions. Visual data includes images or videos that capture specific characteristics of the time series, such as trends or seasonality. Textual data includes written descriptions or labels that provide additional context about the data.
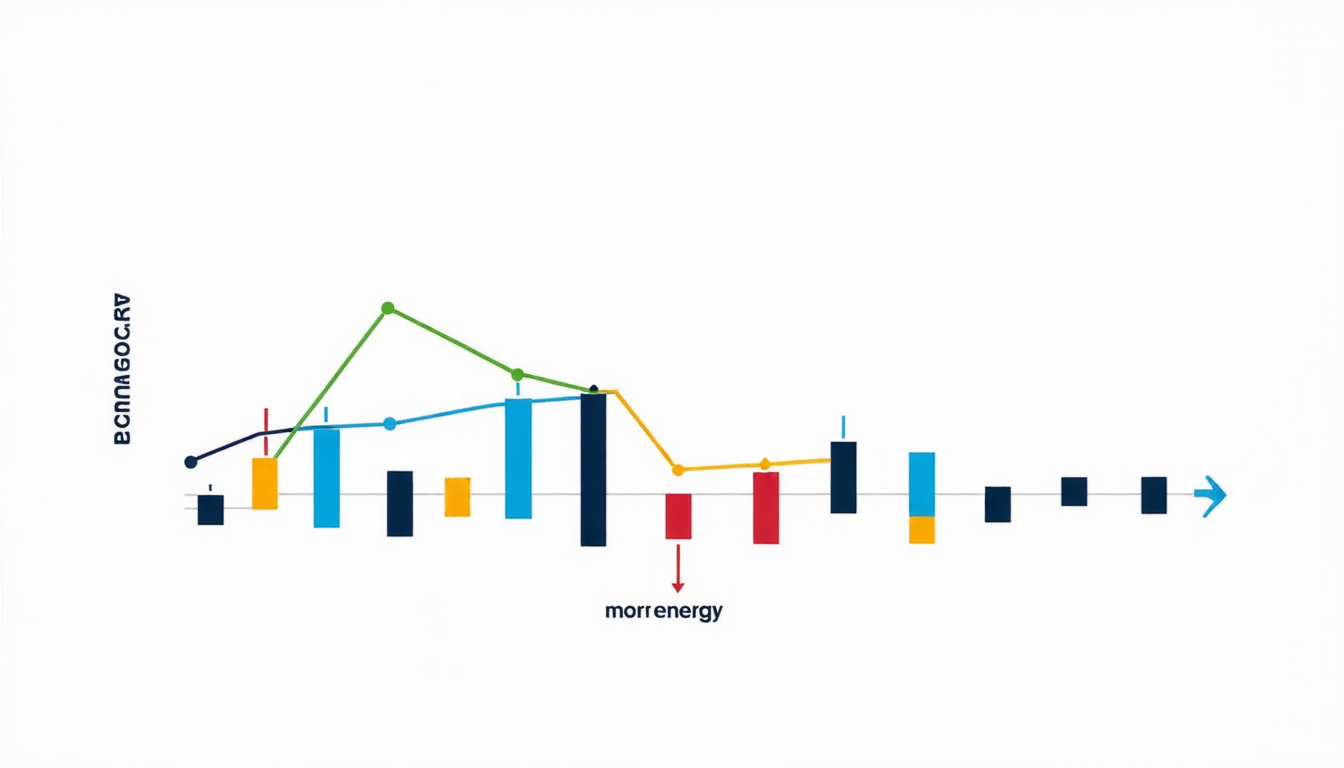
One example of how this approach can be used is in predicting energy consumption patterns. By analyzing images of energy usage over time, scientists can identify trends and patterns that may not be immediately apparent from looking at the raw data. For instance, they may notice that energy consumption tends to peak during certain times of day or on specific days of the week.
At the same time, textual data such as weather forecasts or holiday schedules can provide additional context about why energy consumption is peaking at certain times. By combining this visual and textual information, scientists can make more accurate predictions about future energy consumption patterns.
The approach has been tested using several different datasets, including ones related to energy consumption, traffic flow, and stock prices. The results show that the new method outperforms traditional approaches in many cases, especially when dealing with complex or irregular data.
One of the key challenges facing scientists is how to effectively combine visual and textual data. This requires developing new algorithms and techniques that can handle the different types of information and integrate them into a single prediction model.
Another challenge is ensuring that the approach is robust and accurate across different datasets and scenarios. Scientists are working on refining the method to make it more adaptable and generalizable, so that it can be applied to a wide range of time series forecasting problems.
The potential applications of this new approach are vast, from improving weather forecasts to optimizing energy production and consumption. By combining visual and textual data in a way that is both powerful and flexible, scientists may be able to make significant strides in the field of time series forecasting and unlock new insights into complex systems.
Cite this article: “Visualizing the Future: A New Approach to Time Series Forecasting”, The Science Archive, 2025.
Time Series Forecasting, Visual Data, Textual Data, Energy Consumption, Weather Forecasts, Holiday Schedules, Traffic Flow, Stock Prices, Complex Systems, Predictive Modeling