
Sunday 06 April 2025
Researchers have made a significant breakthrough in the field of statistical analysis, developing a new method for testing whether two samples are significantly different. This innovative approach uses confidence intervals to visualize the results, making it easier for scientists and researchers to understand and interpret their findings.
The traditional way of comparing sample means involves constructing hypothesis tests, which can be complex and difficult to grasp. In contrast, the new method provides a straightforward and intuitive approach by using overlapping confidence intervals. By visualizing these intervals, researchers can quickly determine whether the means are significantly different or not.
The technique is based on the concept of e-values, which provide a measure of evidence in hypothesis testing. The researchers have developed an algorithm that uses these values to construct confidence intervals for the sample means. These intervals are then compared to determine if they overlap, indicating whether the means are similar or not.
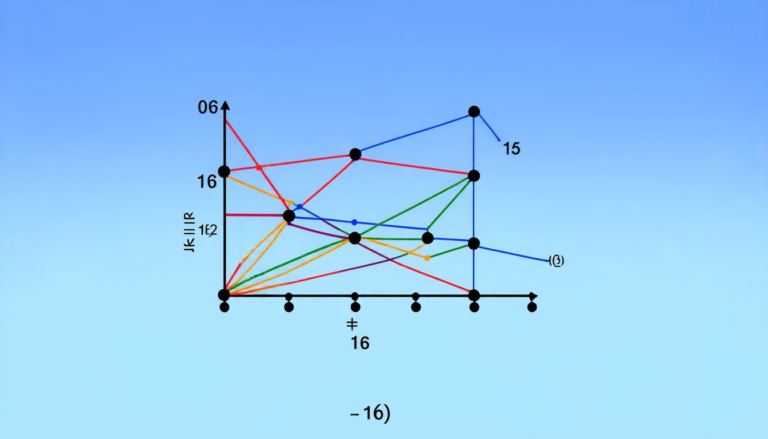
One of the key advantages of this method is its ability to provide a visual representation of the results. By plotting the confidence intervals on a graph, researchers can easily see which samples have overlapping intervals and which do not. This makes it easier to identify significant differences between the samples without having to rely on complex statistical calculations.
The new method has several practical applications in various fields, including medicine, biology, and social sciences. For example, in medical research, scientists may use this technique to compare the effectiveness of different treatments or medications. In biological research, researchers might employ it to analyze the differences between populations or species.
The algorithm is also flexible and can be adapted to different types of data, such as continuous or categorical variables. This makes it a versatile tool that can be applied in a wide range of contexts.
While this breakthrough has significant implications for statistical analysis, it also highlights the importance of visual representation in scientific research. By making complex concepts more accessible and intuitive, researchers can better understand their findings and communicate them effectively to others.
In the past, statistical analysis has often been seen as an abstract and intimidating field, requiring advanced mathematical knowledge and technical expertise. However, this new method shows that it is possible to make statistics more user-friendly and accessible to a broader range of researchers.
The potential impact of this innovation is significant, as it can enable scientists to draw more accurate conclusions from their data and make more informed decisions. By providing a simpler and more intuitive approach to statistical analysis, this breakthrough has the potential to revolutionize the way we conduct research in various fields.
Cite this article: “Visualizing Confidence: A Novel Approach to Safe Hypothesis Testing”, The Science Archive, 2025.
Statistical Analysis, Sample Means, Confidence Intervals, Hypothesis Testing, E-Values, Algorithm, Visual Representation, Medical Research, Biological Research, Social Sciences
Reference: Timothée Mathieu, “Visual tests using several safe confidence intervals” (2025).