
Wednesday 09 April 2025
Time series data is all around us, from stock market fluctuations to traffic patterns and weather forecasts. But how do we make sense of this seemingly endless stream of numbers? A new approach called k-Graph may hold the key.
The problem with traditional time series clustering methods is that they often struggle to identify meaningful patterns in the data. This can lead to inaccurate results, making it difficult to draw useful conclusions from the analysis. k-Graph addresses this issue by using a graph-based method to transform the time series into a more interpretable format.
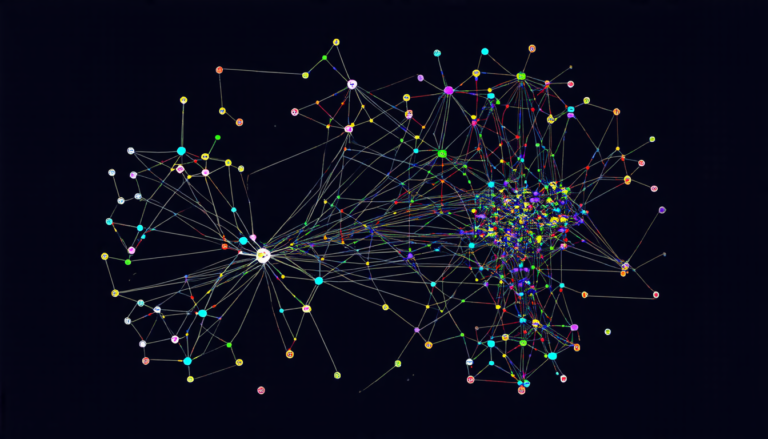
Here’s how it works: k-Graph creates a graph for each subsequence of varying lengths within the time series dataset. This is done by identifying nodes that represent patterns in the data and edges that connect these nodes based on their similarity. The resulting graph is then used to cluster the time series, allowing for more accurate identification of patterns.
But what makes k-Graph truly innovative is its ability to provide interpretability. By analyzing the graph, researchers can identify which nodes are most representative of each cluster, and why they are grouped together in a particular way. This level of transparency is crucial when working with complex data like time series, where small changes can have significant effects.
The k-Graph system has been put through its paces, with impressive results. In tests, it outperformed traditional methods in accuracy and interpretability. Moreover, the system is designed to be user-friendly, allowing researchers to easily explore and visualize their data.
One of the most exciting aspects of k-Graph is its potential applications. From finance to healthcare, time series data is used to make predictions and inform decisions. With k-Graph, analysts can gain a deeper understanding of these patterns, leading to more accurate forecasts and better decision-making.
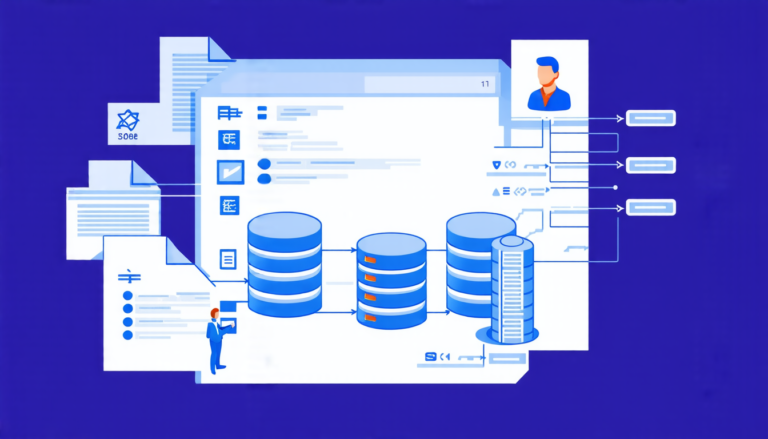
The Graphint system, which accompanies k-Graph, takes this concept to the next level. It’s an interactive platform that allows users to explore their data in real-time, visualizing the graph and identifying key patterns. This level of interactivity is unprecedented in time series analysis, making it possible for researchers to ask new questions and uncover hidden insights.
As researchers continue to develop and refine k-Graph, its potential impact will only grow. By providing a more accurate and interpretable way to analyze time series data, k-Graph has the power to transform entire fields of study. Its ability to identify meaningful patterns and provide transparency is a game-changer for anyone working with complex data.
Cite this article: “Unraveling Time Series Mysteries: Introducing Graphint, a Novel System for Interpretable Clustering”, The Science Archive, 2025.
Time Series Analysis, K-Graph, Graph-Based Method, Clustering, Pattern Recognition, Interpretability, Accuracy, Data Visualization, Graphint System, Interactive Platform, Machine Learning.