Sunday 18 May 2025
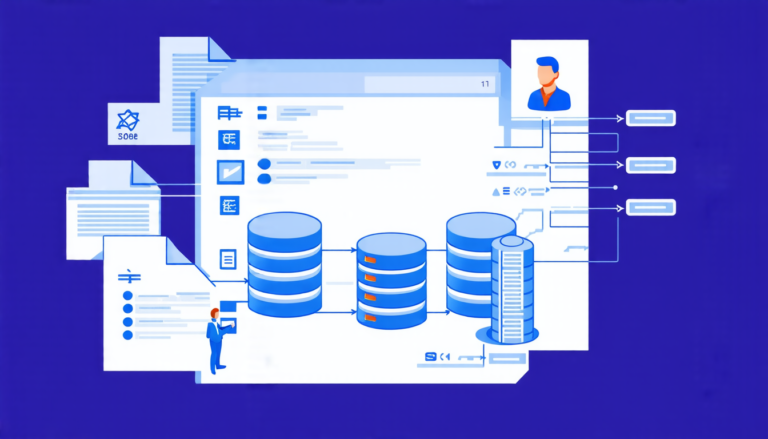
A new tool has emerged that promises to revolutionize the way we design and interact with data visualizations. DashChat, a system developed by a team of researchers, allows users to create complex data dashboards using natural language prompts.
The idea is simple: instead of spending hours crafting custom graphics and layouts, you can simply describe what you want to see and let DashChat do the rest. The system uses a combination of machine learning algorithms and data visualization techniques to generate interactive dashboards that are both informative and visually appealing.
One of the key advantages of DashChat is its ability to handle complex data sets with ease. Whether you’re working with large datasets or trying to visualize specific trends, the system can help you create custom visualizations in a matter of minutes.
But what really sets DashChat apart is its intuitive interface. Users can interact with the system using natural language prompts, which makes it easy to get started even if you have no prior experience with data visualization. And because the system is designed to learn from user input, it can adapt to your specific needs and preferences over time.
The potential applications of DashChat are vast. From business analysts looking to create custom dashboards for their clients to researchers seeking to visualize complex data sets, this technology has the potential to revolutionize the way we interact with information.
Of course, there are still some limitations to the system. For example, it may not be able to handle extremely complex or customized visualizations right away. But as the technology continues to evolve, it’s likely that these limitations will be addressed.
Overall, DashChat is an exciting new tool that has the potential to change the way we interact with data. Its intuitive interface and advanced algorithms make it easy to create custom dashboards, even for those without extensive experience in data visualization. As the technology continues to develop, it will be interesting to see how users take advantage of this powerful new tool.
DashChat is currently available as a preprint paper, but the researchers are working on integrating the system into a user-friendly interface that can be accessed by anyone with an internet connection.
Cite this article: “Designing Data Dashboards with Natural Language Prompts”, The Science Archive, 2025.
Data Visualization, Natural Language Processing, Machine Learning, Dashchat, Data Analysis, Business Intelligence, Research, Graphical User Interface, Interactive Dashboards, Analytics Tools