Friday 31 January 2025
A team of researchers has made a significant breakthrough in understanding how data visualization systems can be improved for domain experts, such as biologists and clinicians. The study found that providing guidance to these experts while they analyze complex datasets can greatly enhance their ability to detect trends and communicate insights.
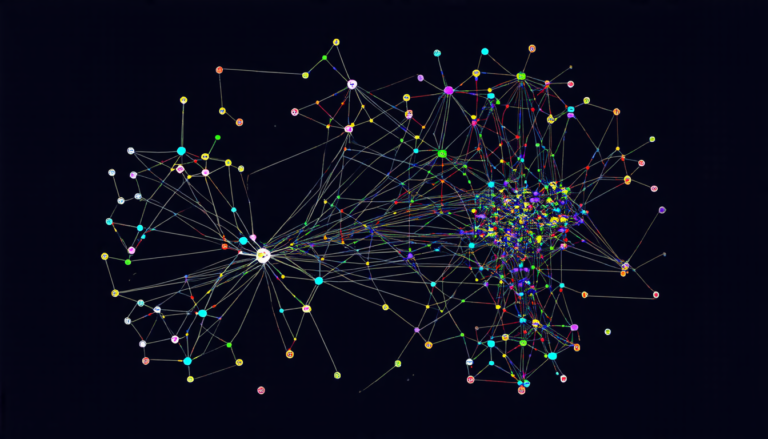
The researchers developed a guided data visualization system called visAPP-prot, which is designed specifically for proteomics analysis. Proteomics is the study of the proteins in an organism’s cells, and it involves analyzing large amounts of complex data. The team tested their system with 11 domain experts from various fields, including biology, computational biology, and medicine.
The results showed that the guided cohort performed significantly better than the unguided group. The guided group was able to quickly identify high-level trends in the data, whereas the unguided group struggled to do so. Additionally, the guided group was more likely to explore detailed information within the dataset, such as relationships between proteins and protein expression levels.
The researchers found that the experts benefited from a coarse-to-fine structure in their analysis, where they started with high-level visualizations and then moved on to more detailed views. This approach allowed them to gain a broad understanding of the data before diving deeper into specific aspects.
One of the key findings was that the experts valued guidance when it came to interpreting visualizations and communicating insights. They found that having a structured approach to analysis helped them to tell a coherent story about their findings, rather than simply presenting a collection of individual results.
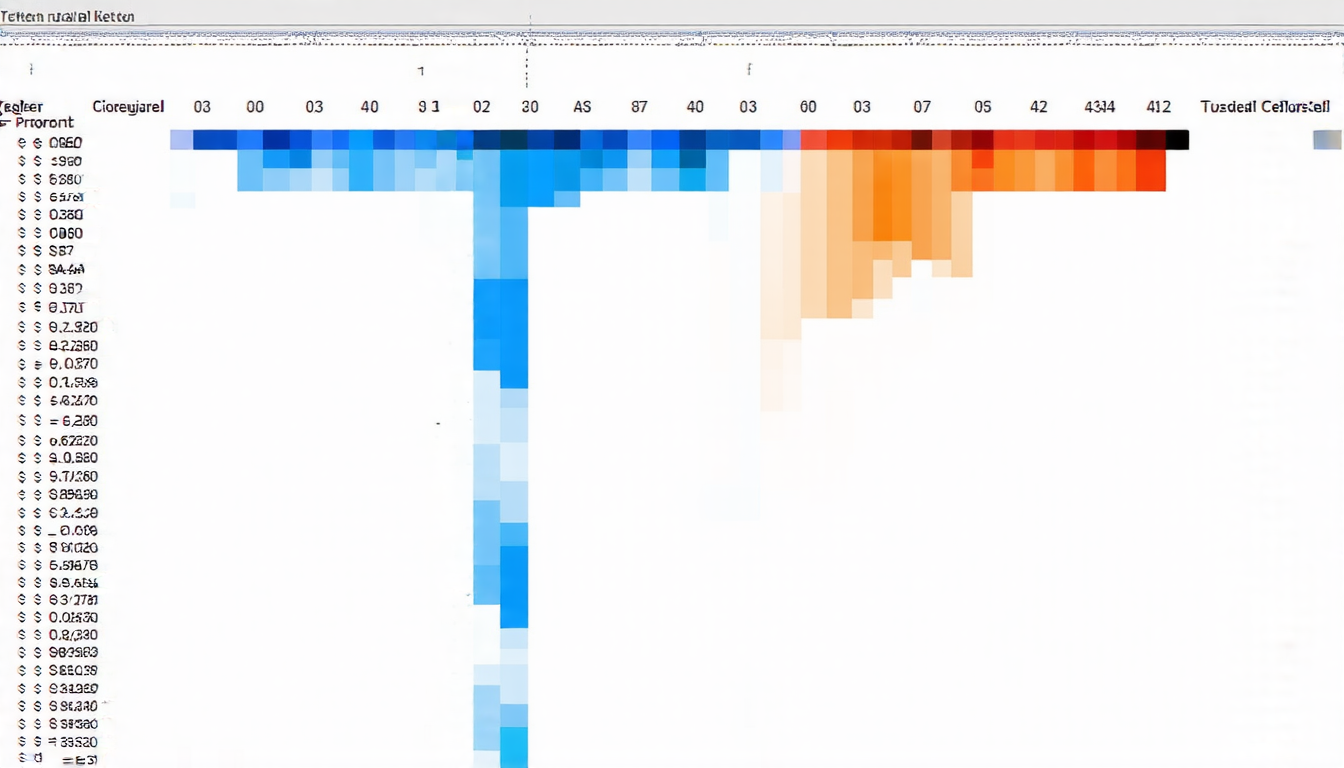
The study also highlighted the importance of dynamic and interactive visualizations in displaying large datasets. The researchers found that participants were more likely to explore detailed information when it was presented in an interactive format, such as a heatmap with scrollable bars.
Overall, this study provides valuable insights into how data visualization systems can be improved for domain experts. By providing guidance and structured approaches to analysis, these systems can help experts to gain a deeper understanding of complex datasets and communicate their findings more effectively.
Cite this article: “Guided Data Visualization Enhances Analysis and Communication for Domain Experts”, The Science Archive, 2025.
Data Visualization, Proteomics Analysis, Guided System, Domain Experts, Trend Detection, Communication Insights, Coarse-To-Fine Structure, Dynamic Visualizations, Interactive Heatmaps, Biomedical Research