Tuesday 25 February 2025
Data analysis is a crucial step in understanding complex systems, but it can be a daunting task when dealing with large and intricate datasets. A team of researchers has developed new visualizations to help make sense of these datasets by providing a clear and intuitive way to examine hierarchical models.
The researchers used Bayesian hierarchical models to analyze the Programme for International Student Assessment (PISA) data, which provides information on student performance in mathematics, reading, and science across different countries. The goal was to understand how students’ performance varied across different regions and income levels.
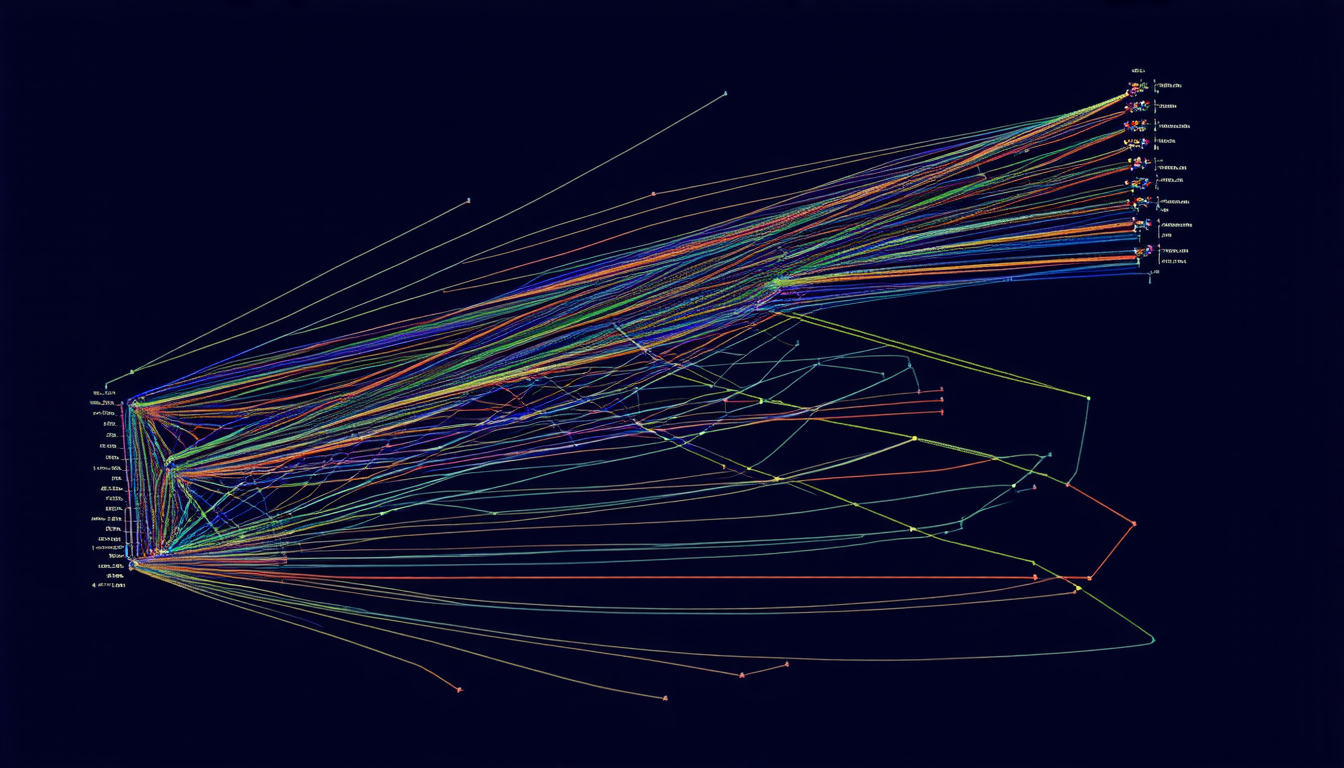
To achieve this, the team developed a set of visualizations that allowed them to compare the estimates from different models with varying hierarchical structures. These visualizations provided a clear and intuitive way to examine the relationships between the model’s parameters and hyperparameters.
One of the key benefits of these visualizations is that they enable researchers to identify patterns and trends in the data that may not be immediately apparent through traditional methods. For example, the team was able to identify countries with similar performance levels across different regions and income levels.
The visualizations also allowed the researchers to compare the predictions from the models with the actual observed data. This provided a way to evaluate the accuracy of the models and to identify areas where they may need improvement.
In addition to their practical applications, these visualizations also provide a new framework for thinking about hierarchical modeling. They demonstrate how visualizations can be used to communicate complex ideas and insights in an intuitive and accessible way.
The team’s work has important implications for many fields, including education, economics, and sociology. By providing a clear and intuitive way to examine hierarchical models, these visualizations have the potential to revolutionize the way researchers approach data analysis.
Overall, this research provides a powerful tool for data analysis and visualization that can be applied to a wide range of fields. By making complex data more accessible and easier to understand, it has the potential to drive new insights and discoveries.
Cite this article: “Unlocking Insights in Hierarchical Models Through Visualization”, The Science Archive, 2025.
Data Analysis, Visualization, Hierarchical Models, Bayesian Methods, Pisa, Education, Economics, Sociology, Research, Statistics