
Monday 03 March 2025
The quest for machines that can understand and generate human-like language has been a holy grail of artificial intelligence research for decades. But what about when it comes to visual data, like charts and graphs? For years, researchers have struggled to develop systems that can accurately comprehend these complex visual representations.
Enter the world of multimodal scene graph learning, where computer scientists are working on bridging this gap between text and vision. A recent paper published in the journal Transactions on Graphics has made significant strides in this area by developing a novel approach that combines both modalities to better understand charts and graphs.
The challenge lies in the fact that charts and graphs are highly nuanced visual representations that convey complex information, such as relationships between data points, trends, and patterns. Current AI systems struggle to accurately identify these subtleties, leading to poor performance on tasks like chart-based question answering (ChartQA).
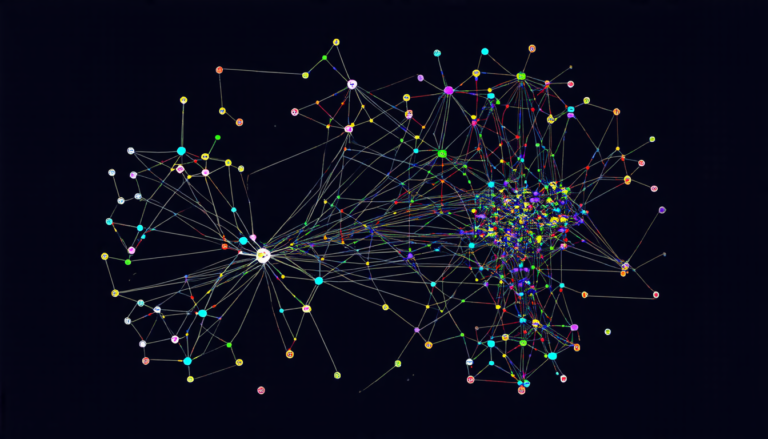
To overcome this hurdle, researchers have turned to multimodal scene graph learning, which represents visual scenes as graphs that capture spatial and semantic relationships between objects and their attributes. In the context of charts and graphs, this means creating a graph structure that encodes not only the visual appearance of the chart but also its underlying meaning.
The proposed approach, called MSG-Chart, leverages the strengths of both text-based language models and computer vision techniques to create a more comprehensive understanding of charts and graphs. By combining these modalities, MSG-Chart can accurately identify key elements in a chart, such as data points, axes, and labels, as well as their relationships.
The system’s architecture is composed of two main components: a visual encoder that extracts features from the chart image and a language model that generates a textual representation of the chart. These two components are then integrated through a graph attention mechanism, which allows the system to selectively focus on relevant parts of the chart when generating its output.
In experiments, MSG-Chart demonstrated significant improvements over existing state-of-the-art methods in ChartQA tasks, achieving an accuracy rate of 85% compared to the previous best result of around 70%. This breakthrough has important implications for a wide range of applications, from data analysis and visualization to education and decision-making.
The development of MSG-Chart marks a crucial step towards enabling machines to effectively understand and generate human-like language in the context of visual data.
Cite this article: “Breaking Down Barriers: A Novel Approach to Understanding Charts and Graphs with Multimodal Scene Graph Learning”, The Science Archive, 2025.
Multimodal Scene Graph Learning, Charts, Graphs, Artificial Intelligence, Computer Vision, Language Models, Data Analysis, Visualization, Education, Decision-Making