
Tuesday 04 March 2025
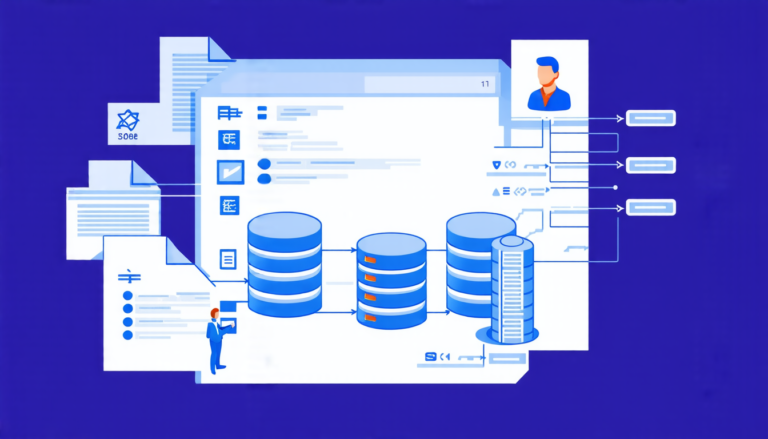
A recent study has shed new light on the importance of accurately extracting information from charts and tables in data analysis. The research team, led by a group of scientists at Synechron, focused on developing a modality conversion module called DEPLOT, which translates visual chart data into structured data tables.
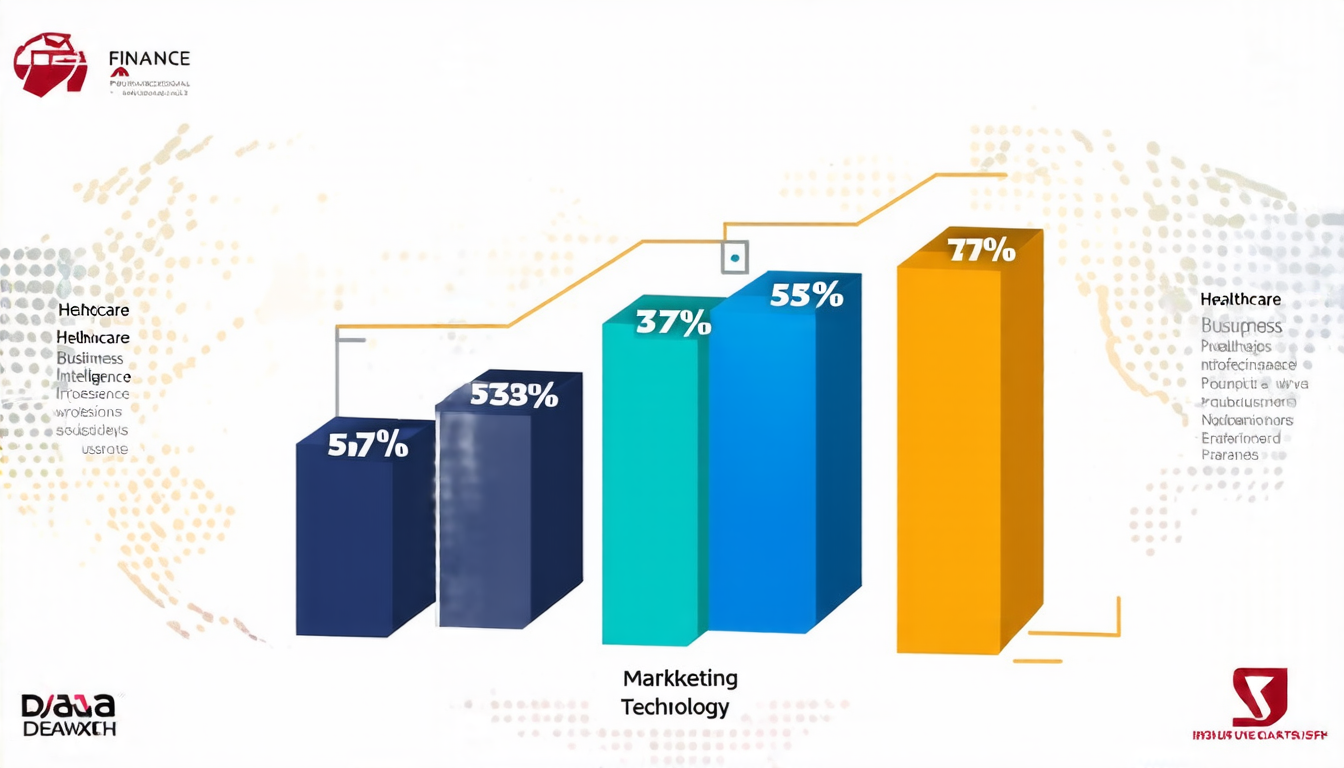
The team’s approach involved fine-tuning the DEPLOT model on a custom dataset of 50,000 bar charts, targeting unique structural features of these visualizations. The evaluation process consisted of comparing the performance of the base model and the fine-tuned model using two key metrics: Relative Mapping Similarity (RMS) and Relative Number Set Similarity (RNSS).
The results showed that providing a structured intermediate table alongside the image significantly enhances large language models’ reasoning performance compared to direct image queries. This finding has significant implications for the field of data analysis, as it highlights the importance of accurate table generation in chart interpretation and mapping.
To further explore this concept, the team created an additional set of 100 bar chart images paired with question-answer sets. The results demonstrated that fine-tuning the DEPLOT model on domain-specific datasets can lead to improved performance in extracting information from charts.
The study’s findings also highlighted the limitations of direct image queries, which often rely on the language model’s ability to understand complex visual data without any additional context. In contrast, providing intermediate tables allows the model to leverage its strengths in structured data processing, leading to more accurate and reliable results.
One of the key takeaways from this research is the importance of understanding the nuances of chart interpretation and mapping. By recognizing the value of structured intermediate tables, researchers can develop more effective strategies for extracting valuable insights from complex data sets.
The study’s findings have significant implications for a range of industries, including finance, healthcare, and business intelligence. As data analysis becomes increasingly important in decision-making processes, it is essential to develop accurate and reliable methods for extracting information from charts and tables.
Overall, this research demonstrates the potential benefits of fine-tuning language models on domain-specific datasets and highlights the importance of structured intermediate tables in chart interpretation and mapping. By recognizing the value of these approaches, researchers can continue to push the boundaries of what is possible in data analysis and unlock new insights for a range of industries.
Cite this article: “Unlocking Insights: The Power of Structured Tables in Chart Interpretation”, The Science Archive, 2025.
Data Analysis, Chart Interpretation, Table Generation, Modality Conversion, Deplot, Large Language Models, Structured Data, Fine-Tuning, Domain-Specific Datasets, Visualizations