
Tuesday 04 March 2025
The ocean, a vast and mysterious expanse that still holds many secrets. For scientists studying its intricacies, visualizing the data can be a daunting task – especially when dealing with massive amounts of information. A new system, dubbed pyParaOcean, aims to change that by providing an interactive and scalable platform for analyzing 3D time-varying fields in oceanography.
The system is designed specifically for oceanographers, who often rely on visual analysis to interpret model simulations, identify events and phenomena, and track dynamic ocean processes. The ever-increasing resolution and complexity of ocean data demands a tool that can keep up with the pace, and pyParaOcean promises just that.
At its core, pyParaOcean is built around a scalable and interactive visualization system called ParaView. This powerful tool allows users to manipulate large datasets in real-time, making it ideal for exploring complex oceanographic phenomena like eddies and currents. The system’s modular design also enables the integration of specialized modules for common analysis tasks, such as identifying salinity movements and tracking scalar fields.
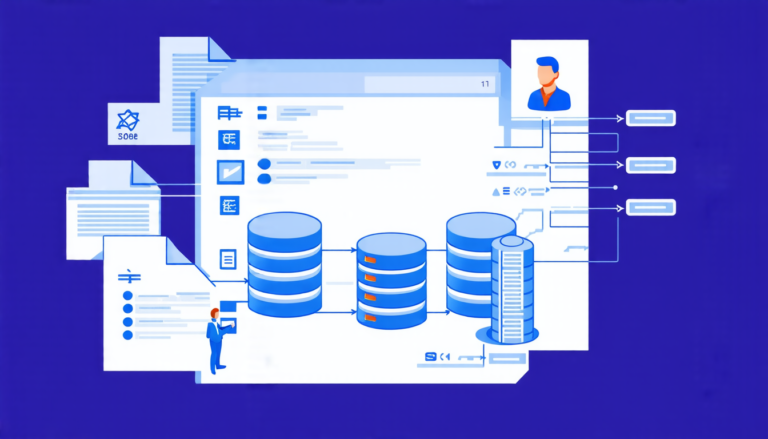
One of the key features that sets pyParaOcean apart is its ability to efficiently handle large datasets. By storing auxiliary data in a Cinema database, the system can address issues related to I/O and network bandwidth bottlenecks, allowing users to generate quick overview visualizations without sacrificing performance. This capability is particularly important for researchers working with massive datasets, who often need to quickly identify patterns or trends.
In addition to its technical prowess, pyParaOcean also boasts a user-friendly interface that allows scientists to focus on the analysis rather than the tool itself. The system’s design philosophy prioritizes interactivity and ease of use, making it accessible to researchers from diverse backgrounds.
To demonstrate the capabilities of pyParaOcean, the researchers behind the project have applied their system to a case study in the Bay of Bengal. By analyzing data from this region, they were able to identify key features such as eddies and currents, providing valuable insights into the complex dynamics at play. This real-world example highlights the potential of pyParaOcean to not only visualize oceanographic data but also to drive scientific discovery.
As scientists continue to explore the mysteries of the ocean, tools like pyParaOcean will be essential for unlocking its secrets. By providing an interactive and scalable platform for analyzing massive datasets, this system has the potential to revolutionize the field of oceanography.
Cite this article: “Unlocking Ocean Secrets with pyParaOcean: A Scalable Visualization Platform for Oceanographers”, The Science Archive, 2025.
Oceanography, Visualization, Pyparaocean, Paraview, Scalability, Interactive, Data Analysis, 3D Time-Varying Fields, Oceanographic Phenomena, Eddies