
Monday 10 March 2025
Scientists have long sought a way to visualize complex topological data, which is used to understand and analyze intricate patterns in fields such as medicine, manufacturing, and environmental science. A new method has been developed that can effectively illustrate these patterns, providing researchers with a powerful tool to better comprehend and interpret their findings.
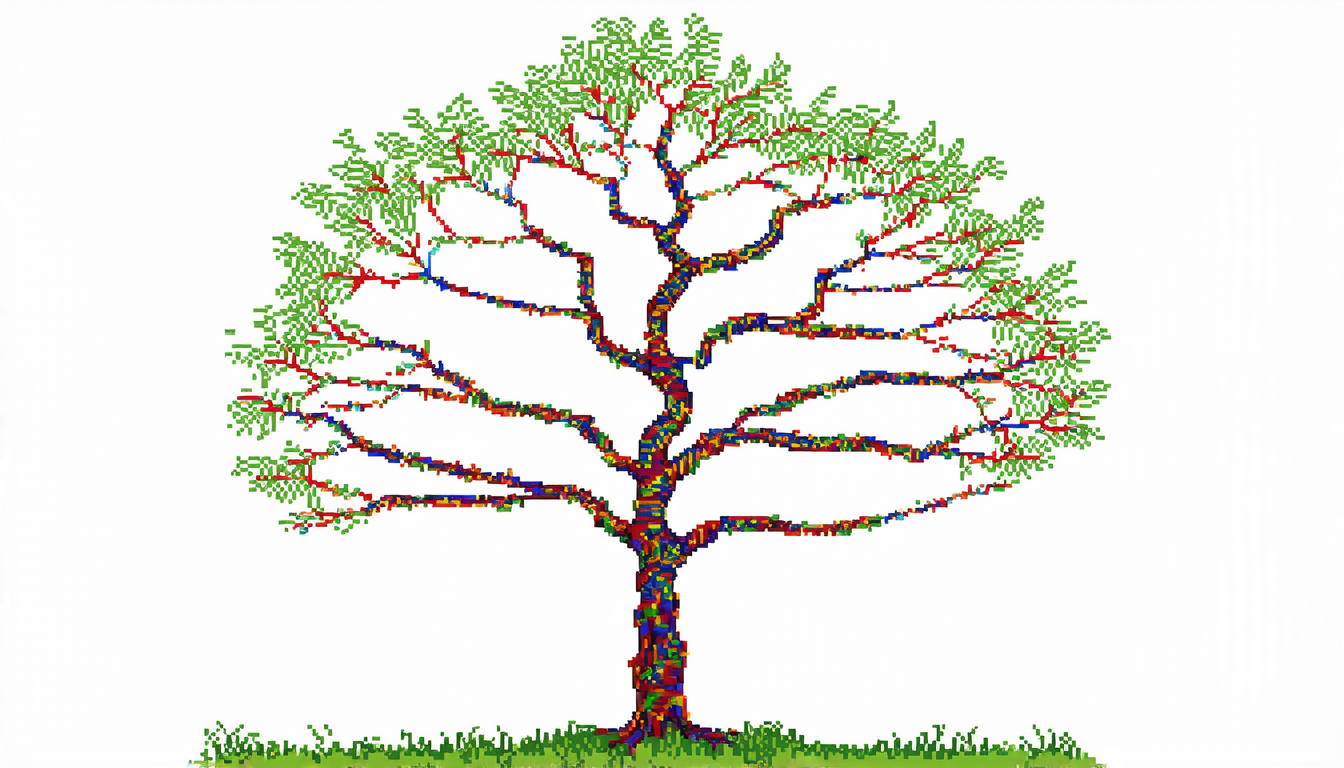
The technique, known as ParkView, uses ordered merge trees to create a visual representation of the data. These trees are constructed by identifying key points in the data, called leaves, and then linking them together using branches. By ordering these leaves according to specific rules, researchers can create a hierarchical structure that reflects the relationships between different parts of the data.
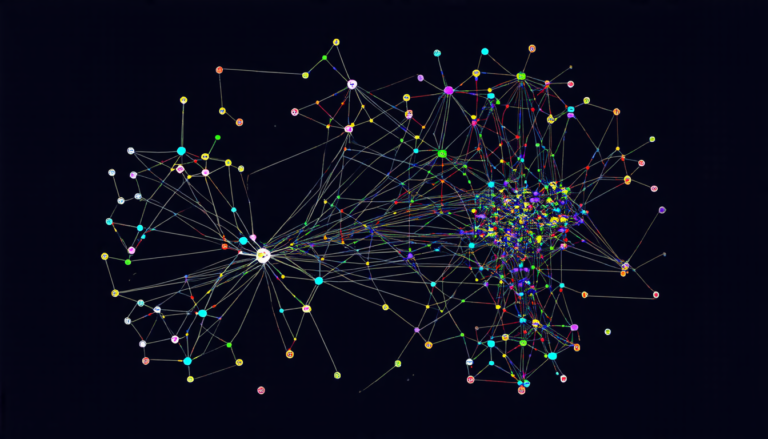
ParkView achieves this by assigning colors to each branch based on its position within the tree. The resulting visualization is a series of colored lines that intersect with one another, creating a unique and informative pattern. This representation allows researchers to quickly identify patterns and relationships in the data that may have been difficult or impossible to discern through traditional methods.
One of the key benefits of ParkView is its ability to handle large datasets. Traditional visualization techniques often struggle when dealing with massive amounts of data, resulting in cluttered and overwhelming images. ParkView, on the other hand, can effectively process and display even the largest datasets, providing researchers with a clear and concise view of their findings.
The technique has already been applied to several fields, including medical imaging and environmental science. In medical imaging, ParkView has been used to analyze the movement of tumors over time, allowing doctors to better understand the progression of cancer and develop more effective treatment strategies. In environmental science, it has been used to study the migration patterns of animals, providing valuable insights into how species adapt to changing ecosystems.
ParkView is a significant advancement in data visualization, offering researchers a new and powerful tool for analyzing complex topological data. Its ability to effectively handle large datasets and provide clear and concise visualizations makes it an invaluable asset for scientists working in a wide range of fields.
Cite this article: “ParkView: A New Method for Visualizing Complex Topological Data”, The Science Archive, 2025.
Data Visualization, Topological Data, Parkview, Ordered Merge Trees, Hierarchical Structure, Colored Lines, Patterns, Relationships, Large Datasets, Medical Imaging, Environmental Science