
Tuesday 11 March 2025
Monitoring complex systems like manufacturing processes, financial markets, or even the weather can be a daunting task. One of the biggest challenges is dealing with data that’s not just random and noisy, but also correlated – meaning that changes in one variable affect others.
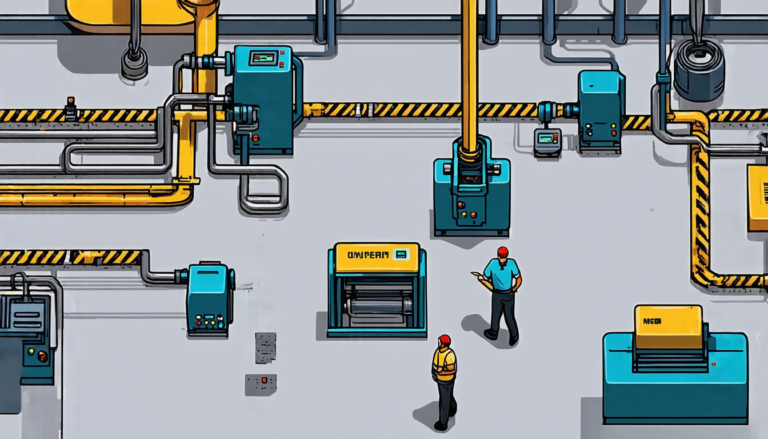
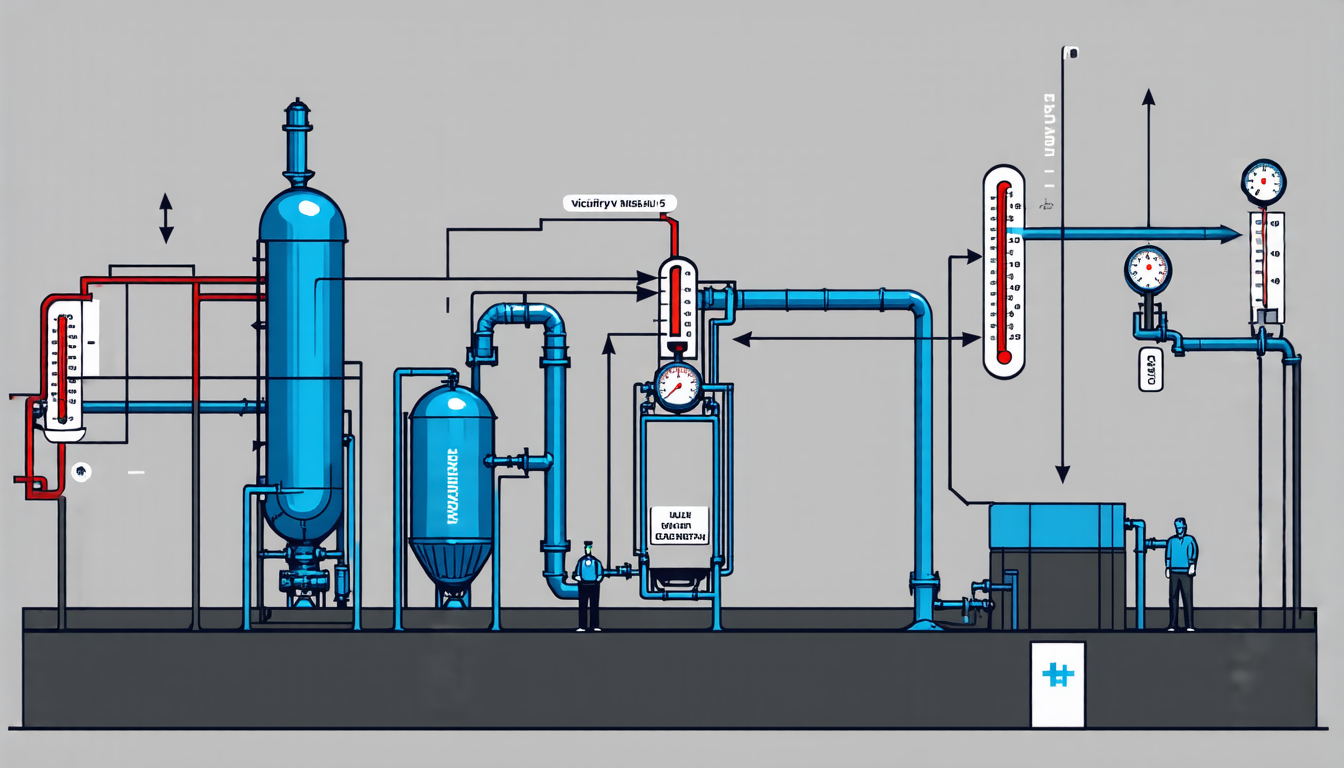
Take, for example, the temperature and humidity levels in a chemical plant. If the temperature increases, it can cause the humidity to rise, which can then affect the chemical reaction process. This correlation makes it difficult to detect anomalies or changes in the system, as small fluctuations in one variable can have ripple effects throughout the entire process.
Researchers have developed various statistical methods to tackle this problem, but most of them rely on simplifying assumptions that don’t always hold true in real-world scenarios. A new study, however, presents a more comprehensive approach to monitoring complex systems with correlated data.
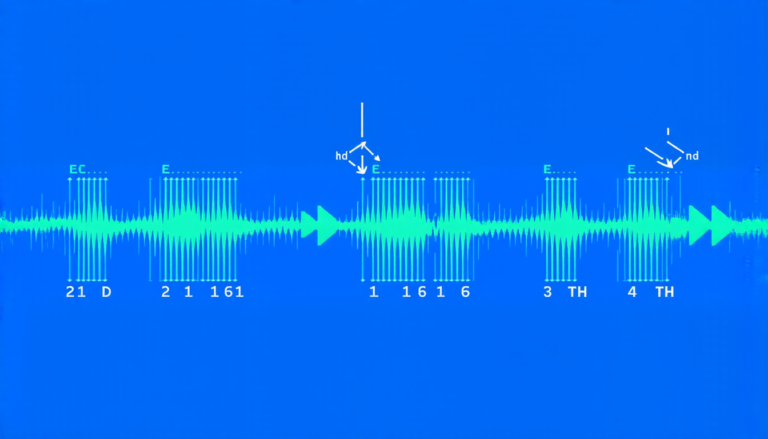
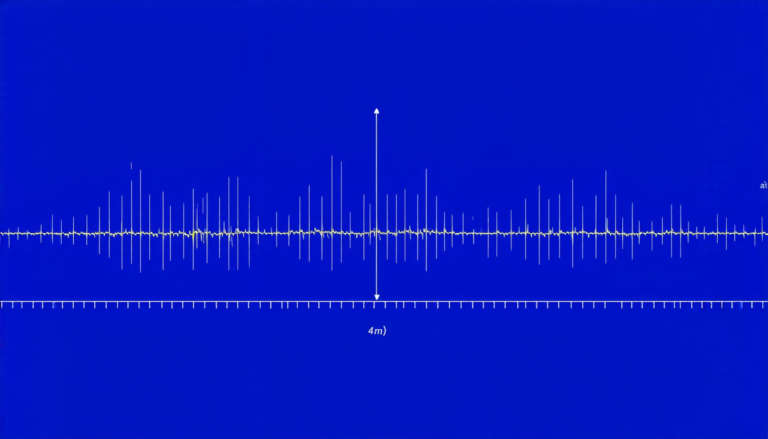
The researchers developed a novel method based on a type of statistical model called the Vector Autoregressive (VAR) model. This model takes into account not only the relationships between different variables, but also their temporal dependencies – how they change over time. By using this model, the team was able to create a control chart that’s better equipped to detect anomalies and changes in complex systems.
To test their method, the researchers applied it to a dataset from a chemical plant that produces polymers. The dataset included temperature, humidity, and viscosity measurements taken at regular intervals over several days. By analyzing these data using their new approach, they were able to identify patterns and correlations that weren’t apparent when using traditional methods.
The results showed that the VAR-based control chart was more effective in detecting anomalies and changes than traditional charts. This means that manufacturers could potentially use this method to improve the quality of their products by identifying and addressing issues earlier on. Similarly, financial analysts could use it to better monitor market trends and predict fluctuations.
The study’s findings have significant implications for a wide range of fields, from manufacturing and finance to environmental monitoring and healthcare. By developing more sophisticated methods for analyzing complex systems with correlated data, researchers can help us better understand and manage these systems, leading to improved outcomes and decision-making.
In the future, the team plans to continue refining their approach by exploring its application in other domains and testing it against larger datasets. As our understanding of complex systems continues to evolve, so too will our ability to monitor and control them – ultimately leading to better outcomes for individuals, industries, and society as a whole.
Cite this article: “Monitoring Complex Systems with Correlated Data: A New Approach”, The Science Archive, 2025.
Complex Systems, Correlated Data, Statistical Models, Vector Autoregressive Model, Control Charts, Anomalies Detection, Temporal Dependencies, Chemical Plant, Manufacturing Process, Financial Markets