
Thursday 13 March 2025
Data dashboards have become a staple of modern business and research, providing a quick glance at complex data sets. But what happens when these visualizations are too numerous to comprehend? A team of researchers has developed an innovative solution: a network that connects insights from multiple charts, making it easier to identify the most important findings.
The problem is familiar to anyone who’s ever had to sift through a sea of charts and graphs. With so many different datasets and metrics to consider, it’s easy to get lost in the noise. But what if you could visualize all these connections between insights in one place? That’s exactly what this new framework aims to do.
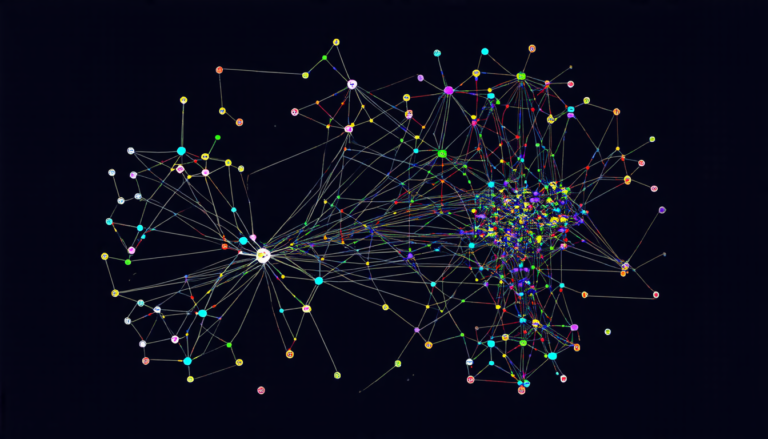
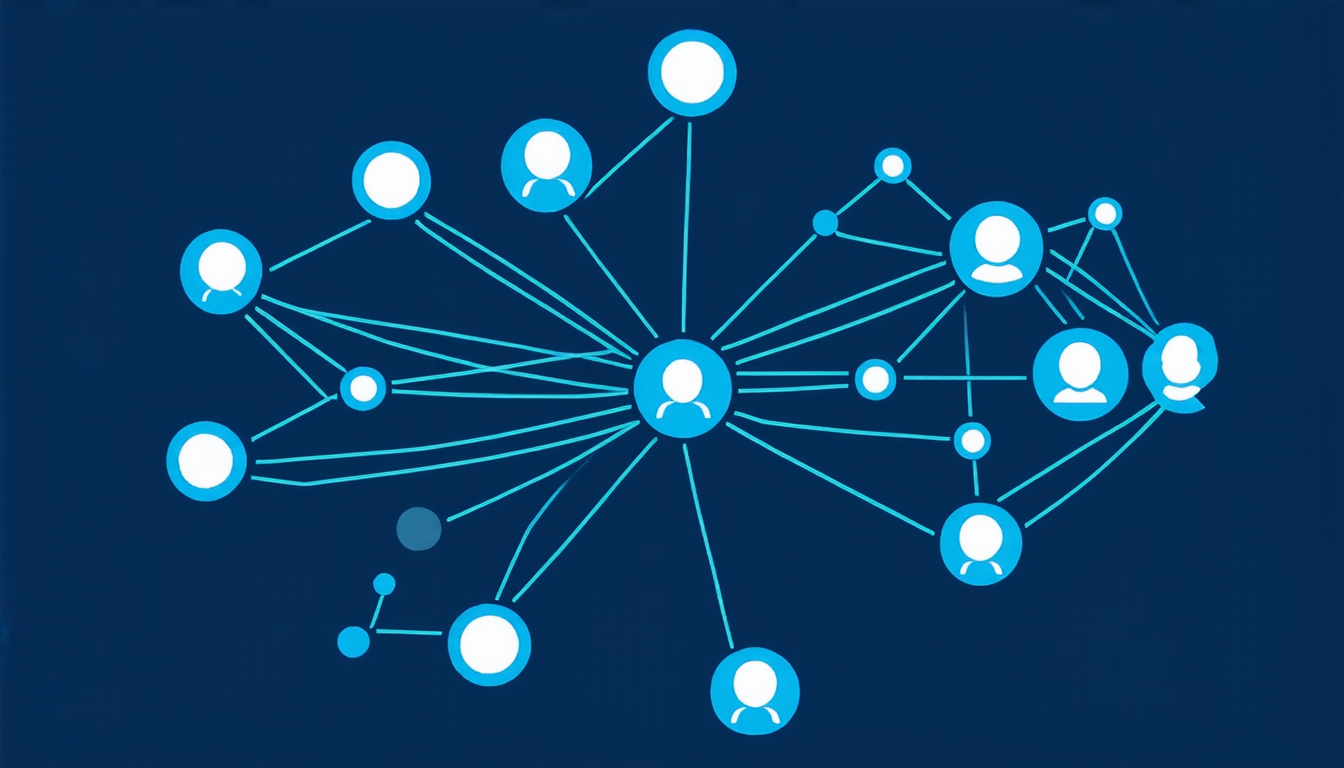
The research team used a combination of machine learning algorithms and natural language processing to create a dense insight network. This network maps out relationships between different insights, such as the types of data they’re based on or the topics they explore. By analyzing these connections, users can quickly identify patterns and trends that might have been difficult to spot otherwise.
One potential application is in business analytics, where this framework could help companies make more informed decisions. For example, a manager might use the network to identify which metrics are most closely linked to customer satisfaction or revenue growth. This could lead to targeted improvements, rather than trying to tackle every issue at once.
The researchers also envision using their framework for data storytelling, where it could help create compelling narratives from complex datasets. By visualizing the connections between insights, users could craft more engaging and informative stories that convey key findings in a clear and concise manner.
While this technology is still in its early stages, the potential benefits are significant. By making complex data more accessible and easier to understand, it could have far-reaching implications for fields such as business, research, and even journalism.
In practical terms, the framework consists of five high-level categories of relationships between insights: type, topic, value, metadata, and compound scores. These categories can be used to filter or prioritize insights, allowing users to focus on the most relevant information.
The researchers are now exploring ways to further develop and evaluate their framework, including testing its effectiveness in real-world scenarios. As data continues to play an increasingly important role in our lives, innovative solutions like this one will be crucial for helping us make sense of it all.
Cite this article: “Unlocking Insights: A Network That Connects Complex Data Visualizations”, The Science Archive, 2025.
Data Visualization, Insights, Network, Machine Learning, Natural Language Processing, Business Analytics, Data Storytelling, Complex Data, Decision-Making, Innovation