
Thursday 27 March 2025
The quest for a more interpretable way to cluster time series data has been a longstanding challenge in the field of data analysis. Time series data, which consists of measurements taken at regular intervals, is ubiquitous in many domains, including finance, healthcare, and environmental monitoring. However, clustering this type of data can be tricky because it’s often difficult to determine what constitutes a meaningful cluster.
Traditional methods for clustering time series data rely on distance measures, such as Euclidean or Dynamic Time Warping distances, which can be misleading when dealing with complex patterns in the data. In recent years, feature-based methods have gained popularity, where the time series is transformed into a set of features that are then used to cluster the data. While these approaches have shown promise, they often lack interpretability and can be sensitive to noise.
A new paper published in the Journal of LaTeX Class Files presents an innovative approach to clustering time series data that addresses these limitations. The authors introduce k-Graph, a method that leverages graph representation learning to identify meaningful clusters in time series data. Unlike traditional methods, k-Graph does not rely on distance measures or feature extraction, but instead uses a novel technique called subsequence embedding.
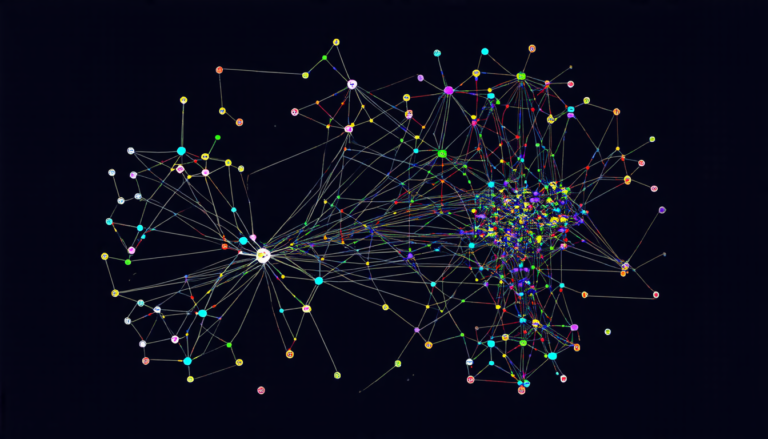
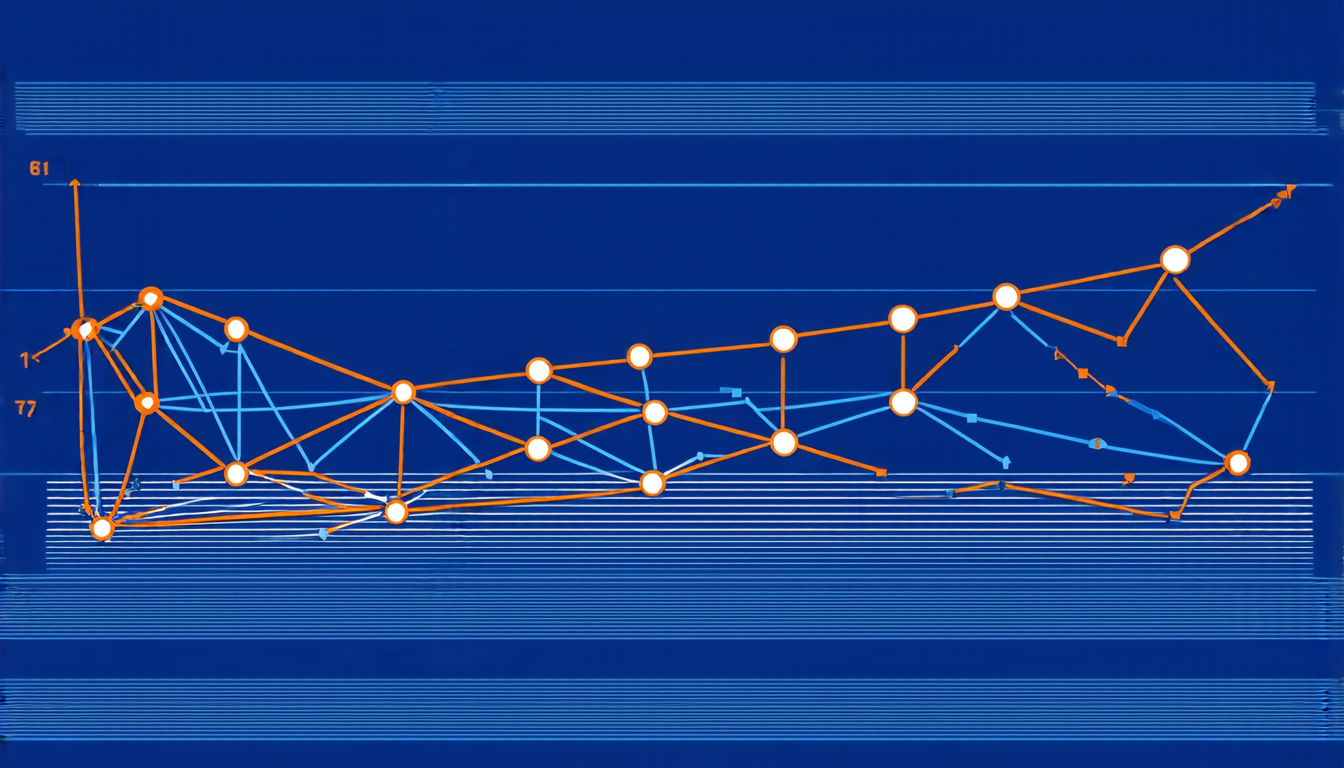
The idea behind subsequence embedding is to transform the time series into a set of subsequences, which are then used to construct a graph. Each node in the graph represents a subsequence, and the edges between nodes capture the relationships between the subsequences. By analyzing this graph, k-Graph can identify clusters that correspond to meaningful patterns in the data.
One of the key advantages of k-Graph is its ability to handle variable-length time series and noisy data. Traditional methods often struggle with these types of data because they rely on fixed-length windows or require preprocessing steps to remove noise. In contrast, k-Graph can adapt to the complexity of the data and identify meaningful patterns even in the presence of noise.
The authors demonstrate the effectiveness of k-Graph using several real-world datasets from various domains, including finance and environmental monitoring. Their results show that k-Graph outperforms traditional methods in terms of accuracy and interpretability, providing users with a deeper understanding of the underlying patterns in the data.
While k-Graph is still an early-stage technique, its potential to revolutionize time series analysis is significant. By providing a more interpretable way to cluster time series data, k-Graph has the potential to unlock new insights and applications across many domains.
Cite this article: “Unlocking Insights in Time Series Data with k-Graph Clustering”, The Science Archive, 2025.
Time Series, Clustering, Data Analysis, Machine Learning, Graph Representation, Subsequence Embedding, K-Graph, Feature Extraction, Distance Measures, Pattern Recognition