
Thursday 27 March 2025
For decades, scientists and researchers have been trying to make sense of the vast amount of information that’s being published every year. With millions of papers being written, it can be overwhelming for anyone to keep track of what’s happening in their field, let alone across multiple disciplines. That’s where science mapping comes in – a way to visualize and analyze the relationships between different ideas and concepts.
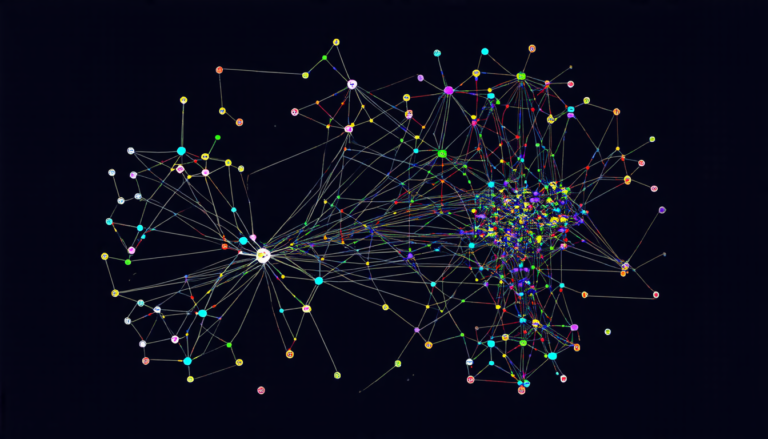
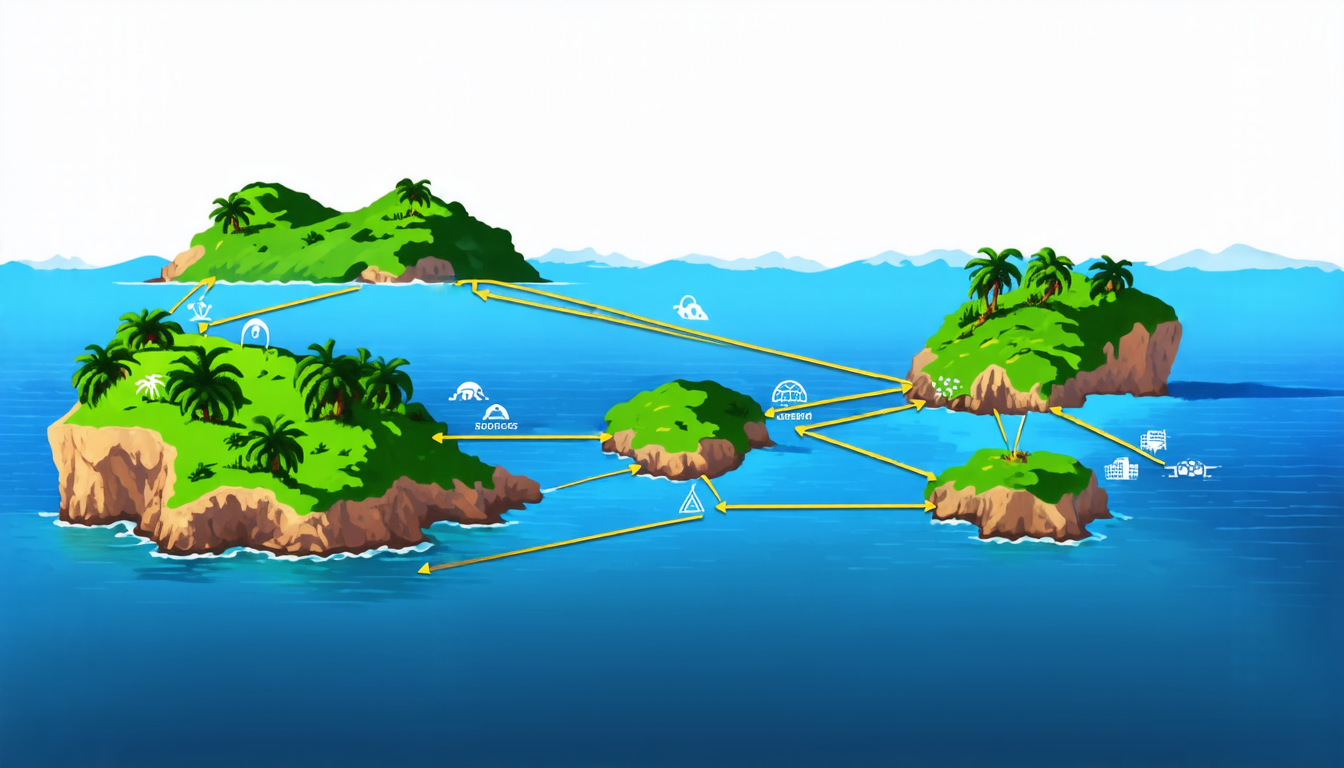
By using sophisticated algorithms and statistical methods, researchers can create maps that show how different papers are connected to each other. These connections can be based on keywords, co-authors, or even the similarity of abstracts. The result is a visual representation of the scientific landscape, with clusters of related research forming like islands in a sea of information.
One of the key benefits of science mapping is that it allows researchers to identify patterns and trends that might not be immediately apparent from reading individual papers. By seeing how different ideas are connected, scientists can get a sense of what’s driving innovation and progress in their field. They can also use this information to identify gaps in knowledge and potential areas for future research.
Another advantage of science mapping is its ability to help researchers navigate the vast amount of information that’s being published every year. With millions of papers being written, it can be difficult to keep track of what’s important and what’s not. Science maps provide a way to filter out the noise and focus on the most relevant research.
One recent study used science mapping to analyze the field of library and information science. By creating a map that showed how different papers were connected, researchers were able to identify clusters of related research and see how they had evolved over time. They also found that certain concepts, such as digital libraries and information retrieval, were becoming increasingly important in the field.
The study’s findings have implications for researchers and policymakers alike. By understanding what’s driving innovation and progress in library and information science, scientists can focus their efforts on areas that are most likely to make a impact. Policymakers can also use this information to inform decisions about how to allocate resources and support research initiatives.
Science mapping is not limited to any one field or discipline. It can be used to analyze the relationships between ideas in fields as diverse as medicine, physics, and sociology. As the amount of published information continues to grow, science mapping is likely to become an increasingly important tool for researchers and policymakers alike.
Cite this article: “Mapping the Frontiers of Science: A New Tool for Research and Policy”, The Science Archive, 2025.
Science, Mapping, Research, Information, Publication, Algorithms, Statistical, Methods, Visualization, Analysis