
Thursday 27 March 2025
Causal connections are the lifeblood of science, helping us understand how one event can lead to another. But navigating these complex relationships is no easy task. A new approach, rooted in the world of statistics and computer science, promises to simplify the process.
Directed Acyclic Graphs (DAGs) are the key to this revolution. These diagrams depict causal relationships between variables, with arrows indicating direction and potential confounding factors represented by nodes. By applying a set of rules, known as d-separation, researchers can identify which paths between exposure and outcome are open or blocked.
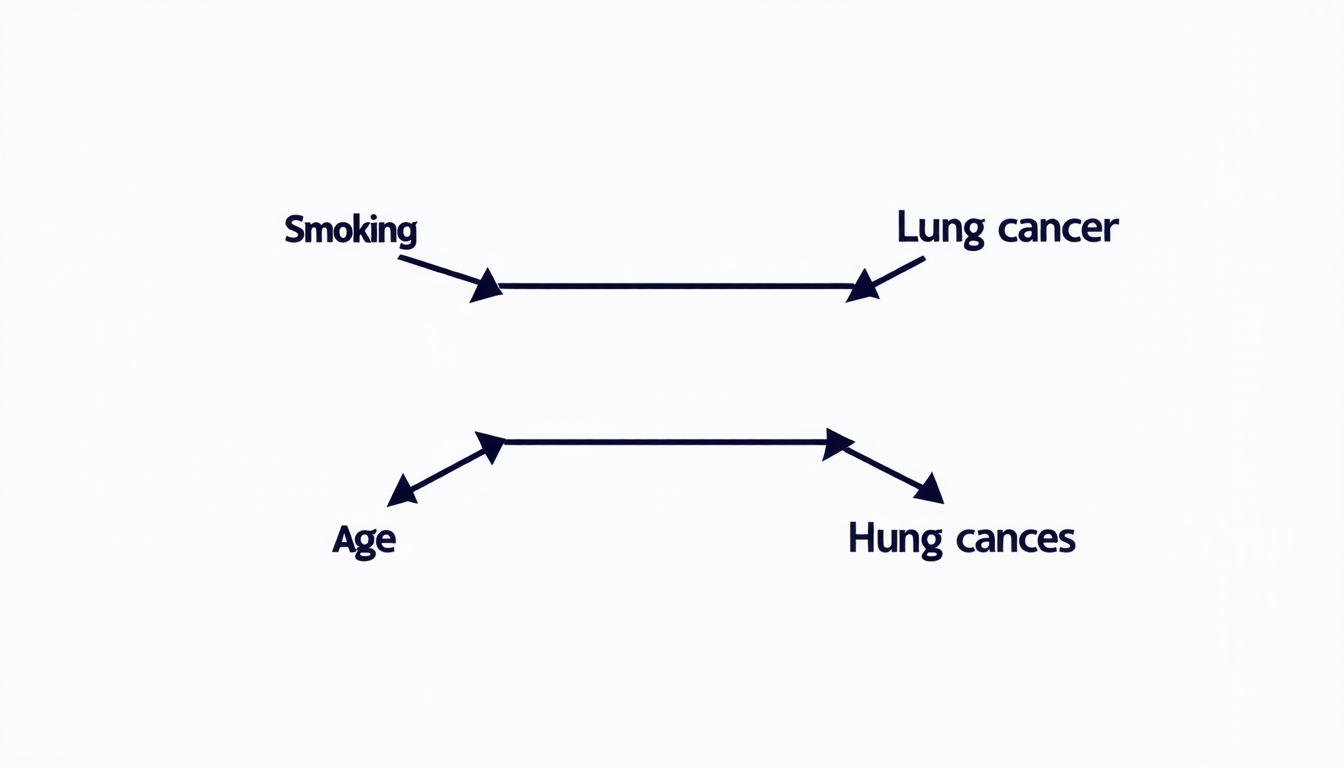
The power of DAGs lies in their ability to reveal the intricacies of causation. Take, for example, the relationship between smoking and lung cancer. A DAG would show how smoking leads directly to an increased risk of cancer, while also highlighting potential confounding factors such as age and genetics. By applying d-separation rules, researchers can isolate the causal effect of smoking on lung cancer, untangling the web of correlations.
DAGs are not limited to simple cause-and-effect relationships. They can handle complex scenarios involving multiple mediators and colliders, allowing researchers to tease apart even the most intricate causal pathways. This is particularly important in fields such as epidemiology, where understanding the causes of disease can have significant implications for public health policy.
But how do DAGs fit into the broader landscape of scientific inquiry? They represent a major shift away from traditional statistical methods, which often rely on assumptions that may not hold true in complex real-world scenarios. By incorporating DAGs into their toolkit, researchers can build more robust and accurate models of causal relationships.
The potential benefits are far-reaching. In fields such as medicine and economics, improved understanding of causation can lead to more effective treatments and policies. In environmental science, DAGs can help untangle the complex relationships between climate change, pollution, and other factors. The possibilities are endless.
Of course, there are challenges ahead. DAGs require a significant amount of expertise in both statistics and computer science, making them inaccessible to many researchers. Additionally, the complexity of real-world systems means that even the most sophisticated models may struggle to capture all the nuances of causation.
Despite these hurdles, the potential payoff is too great to ignore. As our understanding of causal relationships continues to evolve, DAGs will play a crucial role in shaping the future of scientific inquiry.
Cite this article: “Unraveling Causation: The Power of Directed Acyclic Graphs”, The Science Archive, 2025.
Statistics, Computer Science, Causal Connections, Directed Acyclic Graphs, Dags, D-Separation, Confounding Factors, Causation, Epidemiology, Public Health Policy