
Tuesday 08 April 2025
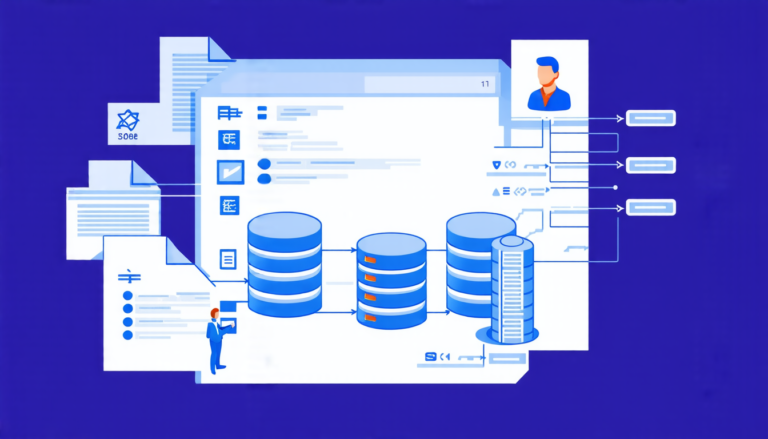
Researchers have created a new visual analytics system that enables users to quickly and easily explore large datasets, uncovering hidden patterns and insights that might have gone unnoticed before. The system, called InsightMap, uses a combination of automated insight extraction and interactive visualization tools to help users navigate complex data sets.
One of the key challenges in exploring large datasets is figuring out what’s important and what’s not. With so much information at their fingertips, users can easily get overwhelmed by the sheer volume of data. That’s where InsightMap comes in. By automatically extracting insights from the data, the system helps users focus on the most relevant findings.
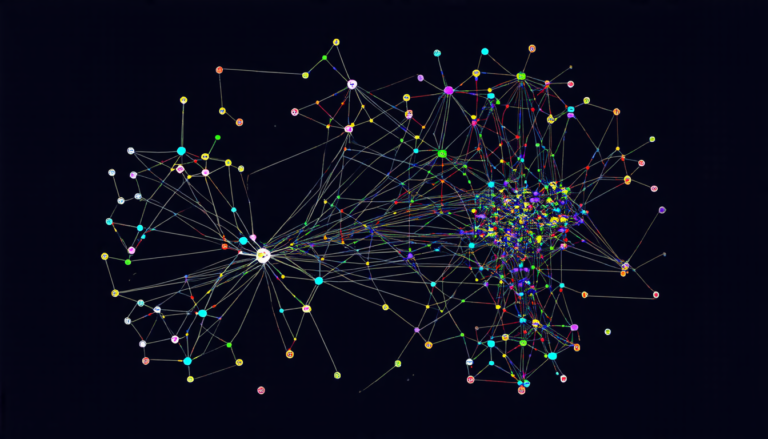
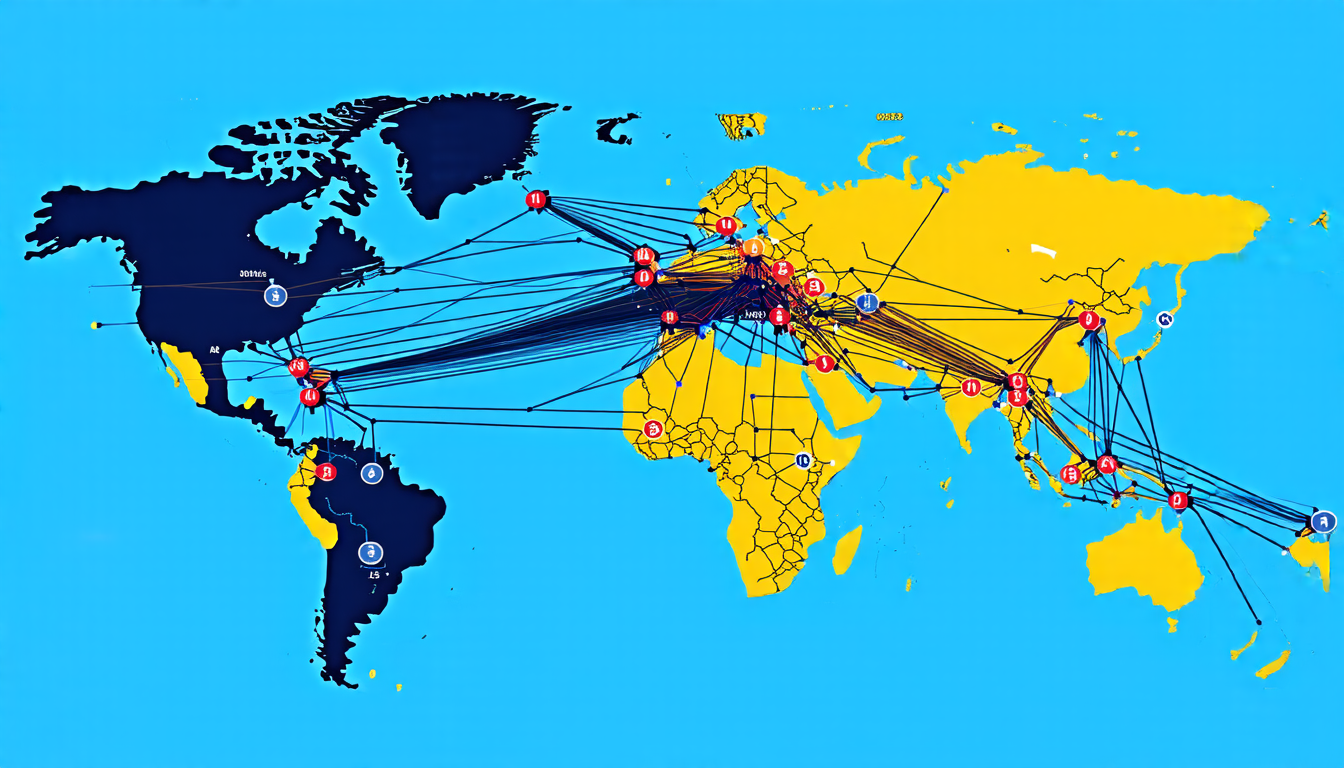
But automated insight extraction isn’t enough on its own. Users still need a way to visualize and explore those insights in a meaningful way. That’s where the interactive visualization tools come in. InsightMap uses a map-based approach to display the extracted insights, allowing users to easily see relationships between different pieces of data and identify patterns that might not be immediately apparent.
The system is designed to be highly flexible, allowing users to customize their exploration experience based on their specific needs. Users can filter the data to focus on specific subsets of information, or use interactive tools to zoom in on particular areas of interest.
In addition to its interactive features, InsightMap also includes a range of visualizations that help users make sense of their data. These include charts, graphs, and other visual aids that provide a quick way to understand complex relationships between different pieces of data.
One of the key benefits of InsightMap is its ability to help users identify unexpected patterns in their data. By automating the process of extracting insights from large datasets, the system can uncover hidden relationships that might not be immediately apparent to human analysts. This can lead to new insights and discoveries that might have gone unnoticed otherwise.
The researchers behind InsightMap believe that the system has a wide range of potential applications. From business analytics to scientific research, any field where data analysis is critical could benefit from the power of InsightMap. The system is designed to be highly flexible, making it easy for users to adapt it to their specific needs and workflows.
In recent tests, InsightMap has been shown to significantly improve the efficiency and effectiveness of data analysis tasks. Users were able to quickly and easily identify important patterns and insights in large datasets, and the system’s interactive features allowed them to explore those findings in a highly intuitive way.
Overall, InsightMap represents an exciting new development in the field of data analytics.
Cite this article: “Unlocking Insights: A Novel Approach to Automated Data Exploration”, The Science Archive, 2025.
Data Analytics, Visualization Tools, Automated Insights, Large Datasets, Interactive Maps, Charting, Graphs, Pattern Recognition, Efficiency Improvement, Business Analytics